What's new in CivilKit Calcs
A short clip of the headline features of each release, then everything the release changed. The clips are a few seconds long, silent and loop; they were recorded from the app itself. Click a clip to enlarge it.
26.11.1
Release notes
Fixed
- Nested and duplicate
#def- A bad#definside a#defblock now keeps its lines inside the outer macro instead of passing them through as normal code, and a duplicate macro name is reported on its own#defline. - Errors in
#UI- Invalid JSON in a#UIline reports one error and is no longer also parsed as math, and an oversized#UIdatagrid reports its error without stopping the run. - Errors in loops and the error limit - Each line now reports a given error once instead of once per loop pass, and the "Too many errors" limit trips at 40 different errors or 1000 occurrences, so a long loop with one bad line no longer stops the run.
- Unclosed
#ifand loops - An unclosed#ifor loop is reported on the line that opened it, and both are reported when both are open. - Smaller error fixes -
#formatwith a bad format now shows the format instead of{0}, the message "Units cannot be raised to complex power" is spelled correctly, and==inside a function call is no longer read as a keyword argument. - Angle operator and phase follow the angle units - The phasor operator reads a unitless angle in the current angle units (
#deg,#rad,#gra) instead of always radians, and works inside$Sum,$Repeatand user functions instead of failing.phasealso follows the angle units andReturnAngleUnitsin real and complex mode. - High precision vectors with implicit zeros - Inverse trigonometric functions on high precision vectors with implicit zeros take the unit of the zero elements from the function result rather than its argument.
- Green and orange ribbon icons on the dark theme - The Checkbox, Input form, Dropdown, Entry and Warning icons were filled as brightly as their check or exclamation mark, so the mark all but disappeared. On the dark theme they now have a dark tinted fill under a bright outline, like the light theme's pale fill under a deep one.
26.10.23
Release notes
Fixed
- A Python chart prints and exports as a picture - A Plotly chart from a Python block, such as the 3D plate deflection surface, was left out of Print PDF, Word and Excel and replaced by a note. The page now keeps a still picture of each chart it draws (light colours, without menus and sliders, at the view you left it in), and print, Word and Excel carry it. A chart that was never drawn still shows the note.
26.10.22
Release notes
Changed
- Ribbon icons redrawn - The whole ribbon icon set is redrawn in the CivilKit icon style shared with CAD: one grid and stroke weight, rounded ends, an accent colour per icon, and light and dark palettes. Icon names are unchanged, and decorative icons are hidden from screen readers (buttons keep their labels).
- Import worksheet says the file is not uploaded - The button's tooltip now states that a
.xmcdor.mcdxfile is converted in the browser and never uploaded; the README opens with a short note for people coming from other calculation tools.
26.10.21
Release notes
Added
- Click to enlarge on What's new clips and guide videos - Click or tap a clip on the What's new page, press Enter or Space on it, or use the Enlarge button on a guide video, to open it in a lightbox at the clip's own pixel size (smaller only to fit the window, full width on a phone) with the video controls, the title and caption. Esc, a click outside or the Close button dismisses it; the arrow keys (and on-screen buttons) step to the previous or next clip; focus is kept inside and returned to the clip; a clip stays paused until played when the system asks for reduced motion. One shared script and stylesheet (
/calcs/zoom/), no dependencies.
Fixed
- A macro whose parameter list is not closed no longer hangs -
#def m$(a$with no closing bracket looped forever; it now reports "Brackets not closed" on that line and the rest of the sheet carries on. asec(0)andacsc(0)carry the angle unit - With angle units returned they give+∞in the current angle unit instead of a bare+∞, like the other inverse trigonometric functions.- Redefining a built-in function names it -
sin(x) = xsays"sin" is a built-in function and cannot be redefinedinstead of a general message about the assignment. - Phone ribbon fits its buttons - On a phone a ribbon tab of big buttons, such as Input/Output, no longer leaves an empty band above the group name; the panel now takes the height of its tallest group.
26.10.20
Page view
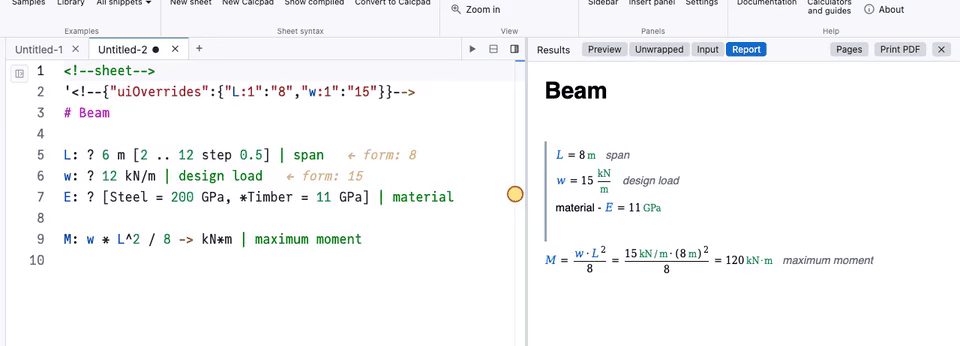
Form values written into the source
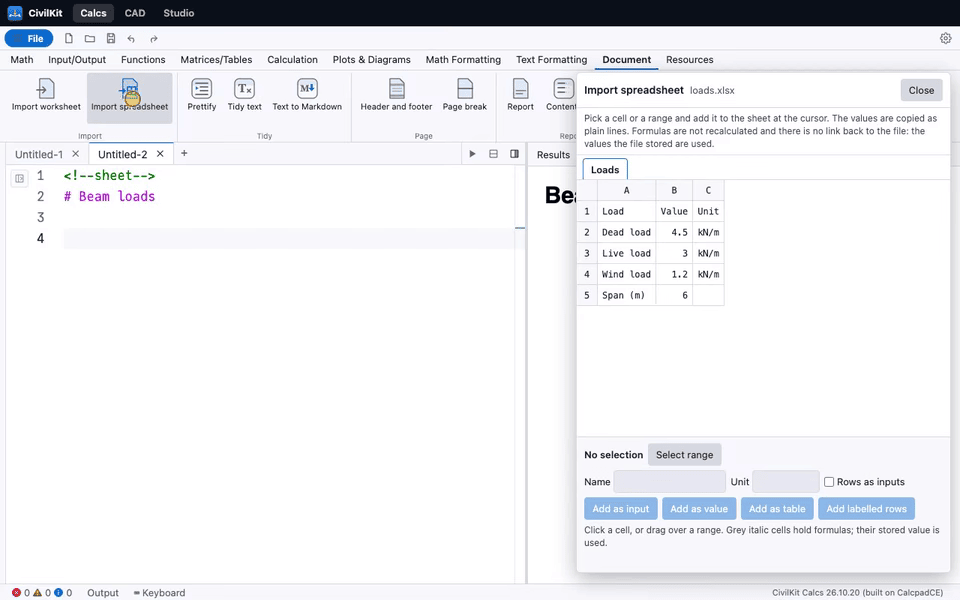
Import spreadsheet
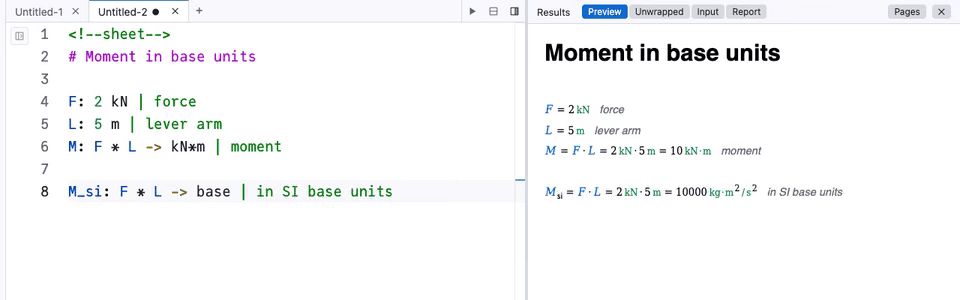
Results in SI base units
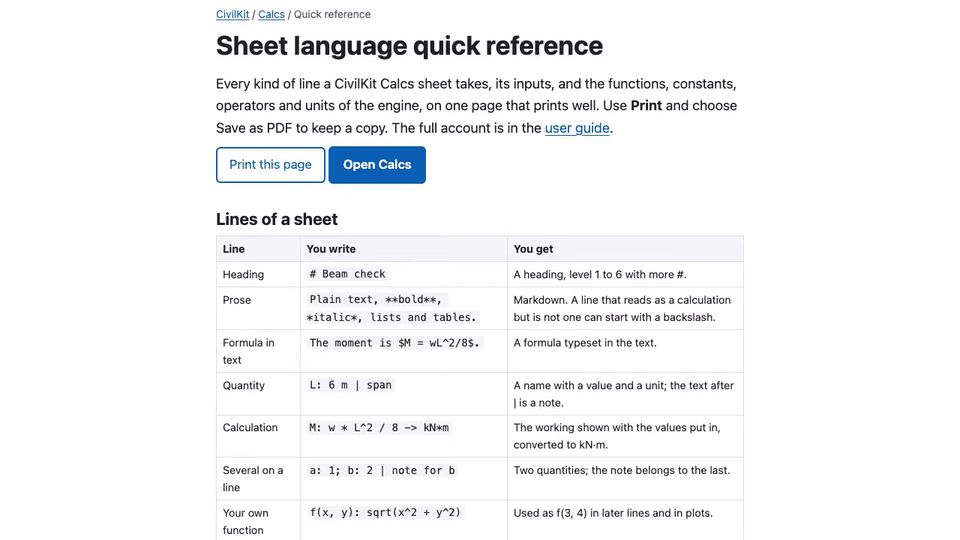
Quick reference page
Release notes
Added
- Import spreadsheet - An Import spreadsheet button (Document tab, and the File menu) opens an Excel or CSV file in a panel with a tab for each sheet and a grid of its values. Pick a cell or a range and add it to the sheet as an input, a value, a table or one quantity per labelled row, with the name and unit guessed from the labels and editable first. The values are copied into plain sheet lines with a small source comment; formulas are not recalculated and nothing stays linked to the file.
- Base units -
-> base(| basein Calcpad) shows a result in SI base units:M: F * L -> basegives10000 kg·m²/s². A value without a unit, or with a temperature or an angle in it, is left as it is. - Quick reference - A printable page of the sheet language at /calcs/reference/: every line kind and input, the functions, constants, operators and units of the engine, and a Print button.
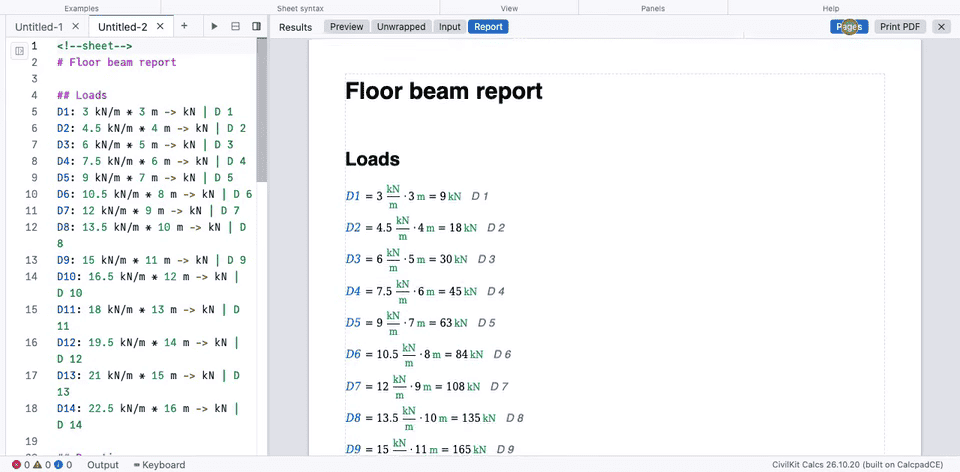
- Page view - A Pages button in the results bar (Preview and Report) lays the results out on sheets of the PDF's paper size, with the margins drawn, the manual page breaks honoured, a "Page 2 of 5" label on each sheet and the automatic page breaks shown, so a long report can be checked without printing it. It follows the PDF settings (and a document's own), is drawn in the light theme as it prints, fits a narrow window, and is screen only.
- Input form values in the source - Input mode gets Update defaults (writes the entered values into the defaults of their input lines: numbers, the
*of a drop-down or radio group, a checkbox, with a slider keeping its bounds), Reset (drops the entered values), and a faint← form: 8mark at the end of an input line whose entered value differs from its default, so the source never silently disagrees with the report. A new setting, Keep Input Form Values in the Source (Settings, Editor), writes each value into its line as it is entered. Off by default. - What's new clips - Five more clips on the What's new page for this release: Page view, input form values in the source, Import spreadsheet, base units and the quick reference.
Changed
- PDF paper defaults to A4 outside North America - Until a paper size is chosen in Settings (Export tab), the PDF, Print and Page view use Letter when the browser's region is the United States, Canada, Mexico, the Philippines, Chile, Colombia, Venezuela or Costa Rica, and A4 everywhere else. A size already saved in Settings is kept.
Fixed
- Base units in the editor - A line ending in
-> basewas underlined with "Undefined unit: 'base'" by the editor's checker although the result was right; it is no longer flagged.
26.10.19
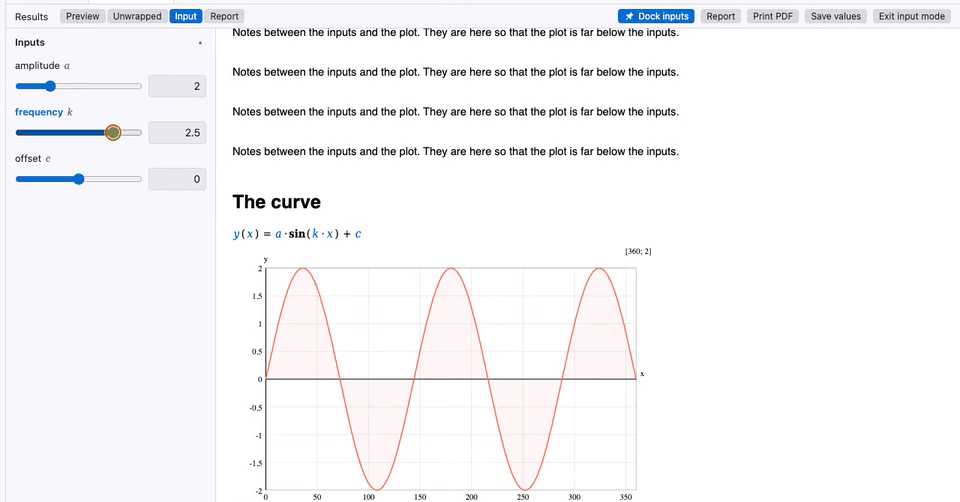
Inputs that stay beside the plot
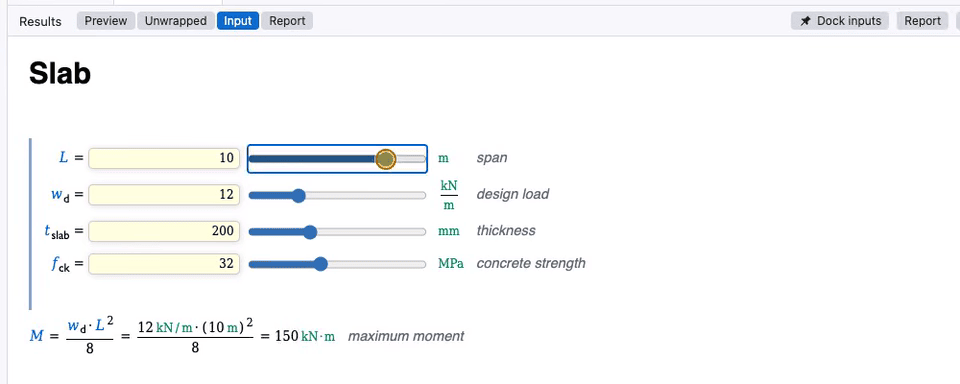
Input rows that line up
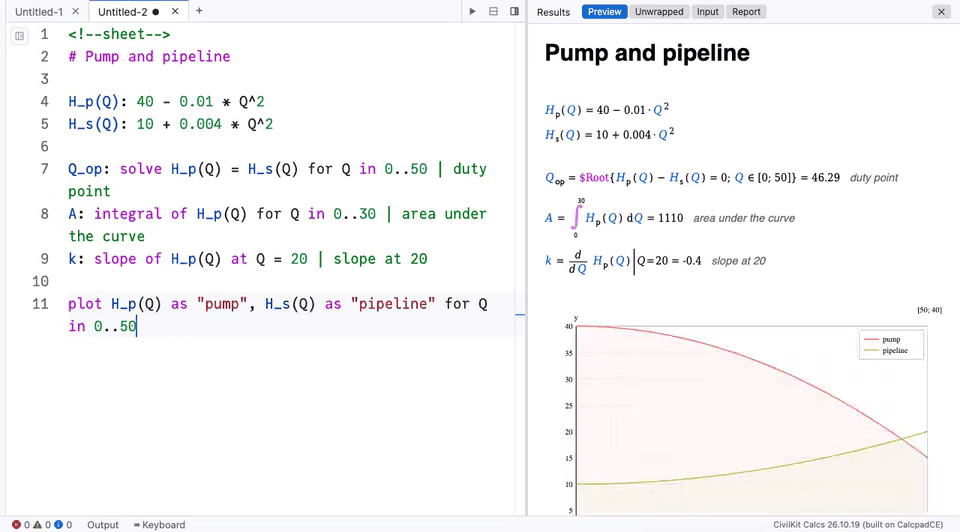
Plot legends, solve, integral and slope
More numpy in Python blocks
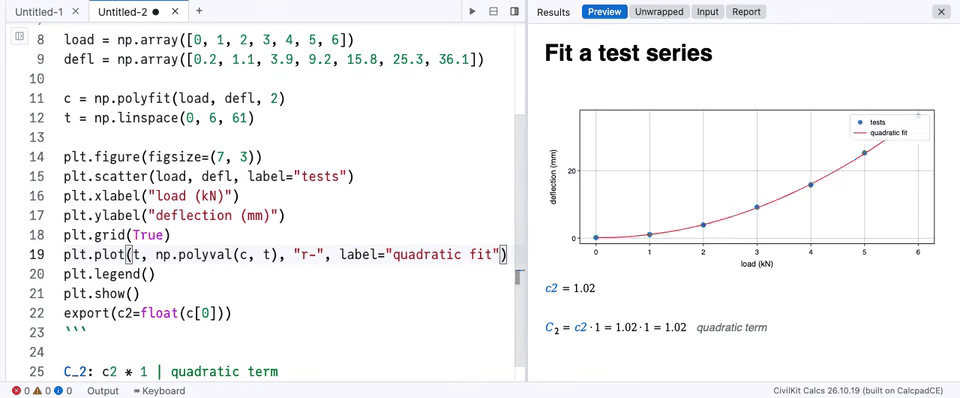
Settings in tabs
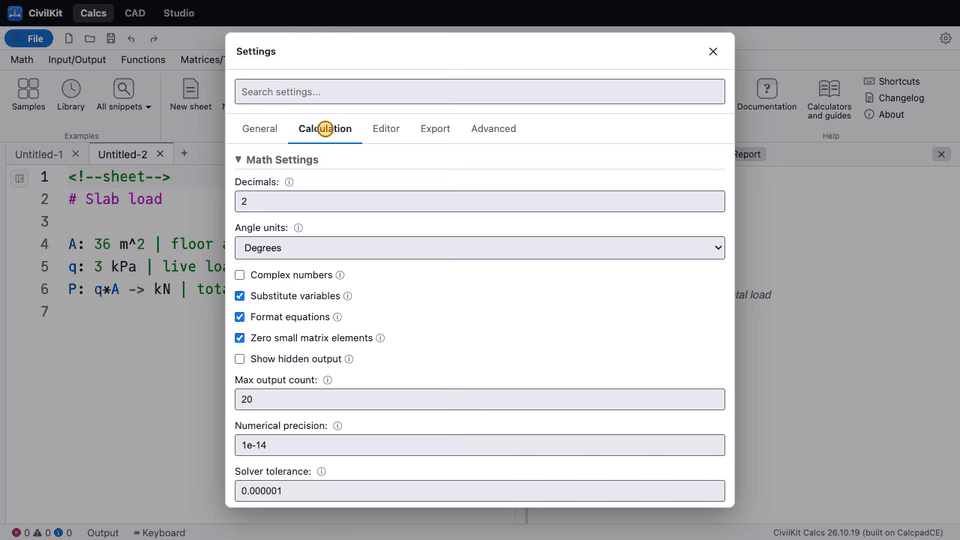
Release notes
Added
- Input rows line up - In Input mode, a run of consecutive input lines now shares its columns: the names (right aligned, so the equals signs meet), the number boxes and drop-downs, the sliders, the units and the notes start at the same place on every row, whatever the length of the name. A text line, a heading or a blank line starts a new run, a single row is left as it was, a very long name is held to 40% of the row and wraps, and on a phone the rows stay lined up without sideways scrolling. Screen only: the report, print and the Word, Excel and PDF exports are unchanged, and nothing about what the controls send back changed.
- Docked inputs - In Input mode, Dock inputs keeps every input of the sheet in a panel beside or above the results while they scroll, so a plot redraws in view as you drag its slider. It is on by default for a sheet with a slider; see Docked inputs in the Templates chapter of the guide.
- Settings gear - A gear at the right end of the top strip opens Settings from any tab, on a phone too; the ribbon icon for Settings is now a cog.
- Interactive panels guide - A new guide chapter shows how to build a Python panel whose sliders redraw a chart, a 3D surface or a table, with its limits and a short summary written for AI assistants.
- Settings tabs - The Settings dialog is split into General, Calculation, Editor, Export and Advanced tabs, and its search box still looks through every tab at once. It reopens on the tab last used, and Calculation settings and Header and footer open their own tab.
- Plot legends - A curve on a sheet
plotline takes a name withas "name"(plot sin(x) as "sine", cos(x) as "cosine" for x in 0..6), and the plot then shows a legend with a colour swatch per curve, in print, PDF and Word too; the Excel chart uses the names for its series. - Solve, integral and slope lines - A sheet quantity can be
x0: solve f(x) = 4 for x in 0..5,A: integral of f(x) for x in 0..3ork: slope of f(x) at x = 3, with units and-> unitas on any quantity line; the Functions palette inserts them in a sheet. - More Python functions - Python blocks gain
math.hypot,math.prod,math.fsumand a few more, andnumpy.hypot,arctan2,meshgrid,outer,interp,polyfitandpolyval. - What's new clips - Eight more clips on the What's new page: three under 26.10.18 (the number format, the interface language and interactive panels) and five for this release (docked inputs, input rows lining up, plot legends with solve, integral and slope lines, the new Python functions, and the Settings tabs).
Fixed
- Semicolons in sheet functions - A sheet definition such as
f(x; y): x + ywas read as plain text, and a call such asmax(3; 7)was an error; inside brackets;now works the same as a comma. - Long Python lists - A list of numbers written out in a Python block stopped at about 2,000 elements with
pystack exhausted; it now takes 16,000, and a longer one is refused with a note on how to build the list instead.
26.10.18
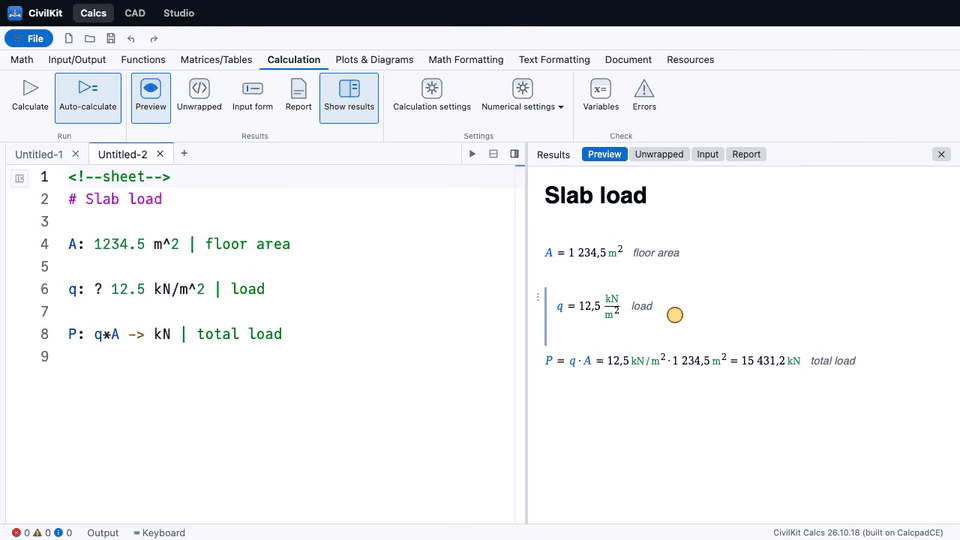
Numbers in your style
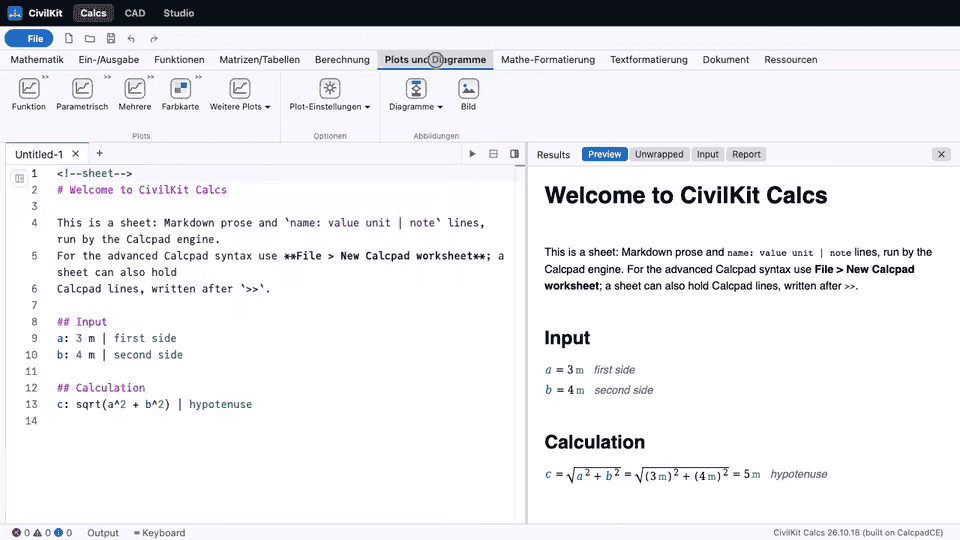
Menus in another language
Interactive panels
Release notes
Added
- Interface language - Settings has a new Language section that switches the ribbon, the Settings dialog, About, Keyboard shortcuts and the block menu between English, Spanish, Portuguese, French, German and Chinese (Simplified), and
?lang=fr(alsoes-ES,pt-BR,deandzh-Hans) picks a language for one page view. A browser set to one of these languages is asked once whether to switch, and either answer is remembered. The translations are machine drafts that no native speaker has reviewed yet, anything not yet translated shows in English, and worksheets, units and formulas are never translated. - Engine messages in your language - A calculation error can be shown in the interface language where its message has been translated; the others stay English.
- Number format - Settings > Number format shows results and number boxes in your language's style: Automatic (from the browser language), Point (1,234.5), Comma (1.234,5) or Space and comma (1 234,5), with digit groups as an option. Number boxes accept both 6,5 and 6.5. The worksheet, saved input values and the engine stay with the decimal point, so files read the same everywhere;
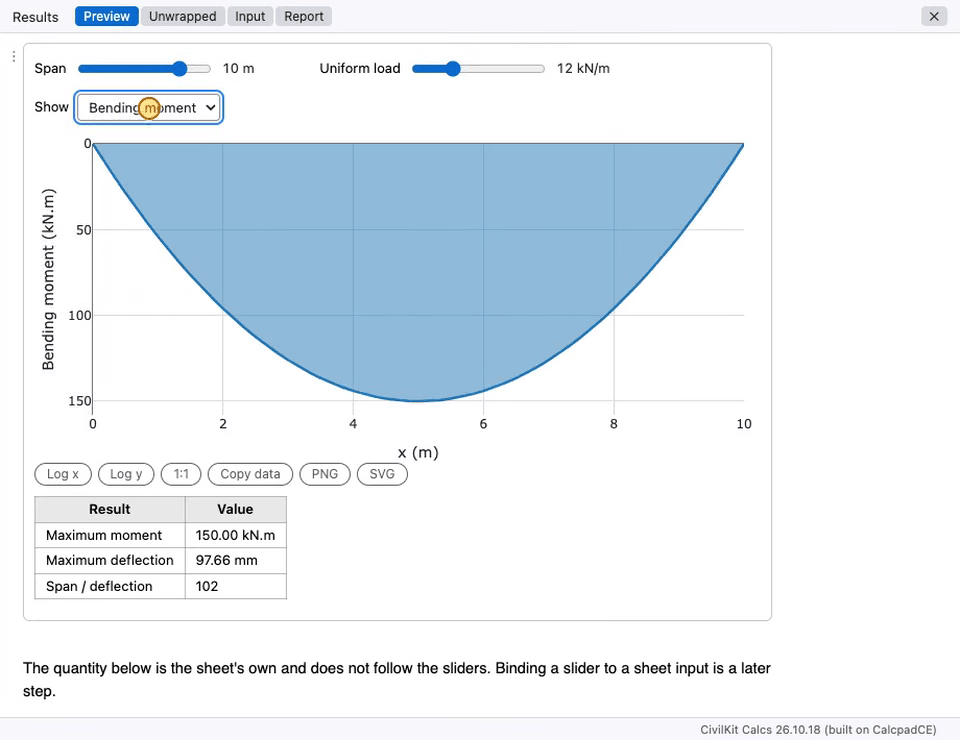
?numfmt=commatries a format on one page. See the number format chapter of the guide. - Interactive panels - A Python block can define a panel whose sliders and drop-downs re-run only one function and redraw its chart and table in place, without recalculating the sheet; three sheets in the Panels group of Samples show it.
- version.json - Every build writes
/calcs/version.jsonwith its version, so pages that show the current release can read it instead of a number typed by hand.
Fixed
- Apostrophes in prose - A sheet line of plain text, a heading or a note after
|that contained an apostrophe (the sheet's own) showed an error such asInvalid syntax: "s own"; apostrophes are now written so they display as typed.
26.10.17
A calculator for any page
Release notes
Added
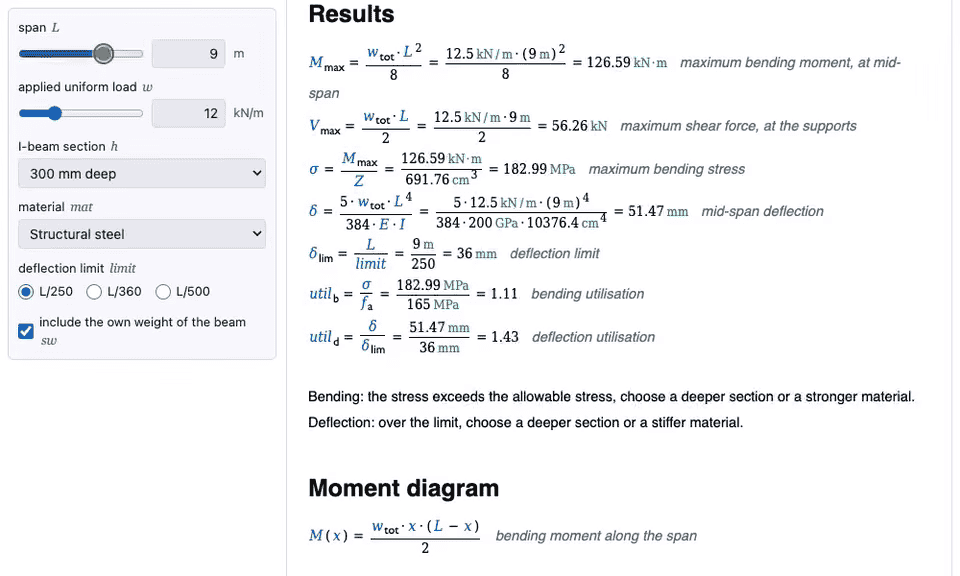
- Embeddable calculators - Adding
?embed=1&sample=<id>to the app address shows one sample as a compact input form with live results, ready to put in an iframe. It stores nothing, sends nothing and links back to the full app. - Embed page and loader - A new page at
/calcs/embed/gives a copy and paste snippet for each calculator, and/calcs/embed.jsplaces the frames and fits their height. - Embed messages - A host page can set inputs and read results with
postMessage, and every value it sends is checked against the sheet's inputs and slider bounds. - Try it on the calculator pages - Each landing page with a sample has a live, lazily loaded sheet to try.
- MCP server - A public, read-only MCP server for AI assistants at
https://civilkit.io/mcp(its own Worker inmcp/) runs sheets and Calcpad worksheets in the app's engine, checks hand calculations, converts units and searches the guide, functions and samples. It is stateless and rate limited, and nothing is stored. - MCP guide chapter - A new chapter explains how to add the server to Claude Code and other clients, with its tools, limits and privacy; llms.txt lists the server and its tools.
- What's new clips - Three more clips on the What's new page: quick convert to a formula, sorting a table by a column, and the embed view.
Fixed
- What's new clips in Chrome - Five clips were encoded as full range video, which Chrome could not decode, so they never played. All 28 clips are now limited range, and a tap or hover on a poster starts a clip on touch screens and with a mouse.
26.10.16
Release notes
Added
- Calculators and guides hub - A new page at
/calcs/learn/lists every landing page, grouped as calculators, alternatives and guides, and a Calculators and guides button on the Resources tab opens it. - Guide pages for search - Every guide page has its own description, a canonical address without
.html, sharing tags and a single h1. Build the guide withbook/build.sh. - App page details - The app page has a description, a canonical address, sharing tags, structured data and a short summary with links for browsers without JavaScript.
- Eleven new landing pages - Calculators for a cantilever, column buckling, moment and shear diagrams, principal stresses, principal axes, shear frame frequencies, gable frame thrust and concrete strength gain, and guides to the beam deflection formula, units and export. Each opens its sheet in the app, and every quoted number comes from the engine.
- Guide links - The guide introduction has a Try it note, and the chapters on templates, plots, units, importing and exporting link the matching calculator pages.
Changed
- Guide addresses - The sitemap, llms.txt and every generated link to the guide use the extensionless addresses the site serves.
- Breadcrumbs - Landing pages, the guide and What's new link CivilKit Calcs to the product page, and breadcrumbs read CivilKit, Calcs, Calculators and guides, then the page.
- Two retitled pages - The worksheet page now covers running
.cpdworksheets offline in the browser, and the converter page covers opening.xmcdand.mcdxfiles.
26.10.15
Diagrams menu on the ribbon
Samples that pair a diagram with the numbers
A ribbon that follows the work
Release notes
Added
- Diagram gallery - The Diagrams chapter of the guide now has a small example to copy for every kind of Mermaid diagram the app draws, from flow charts and Gantt charts to Sankey, radar and railroad diagrams, and lists the one kind that is not available (ZenUML).
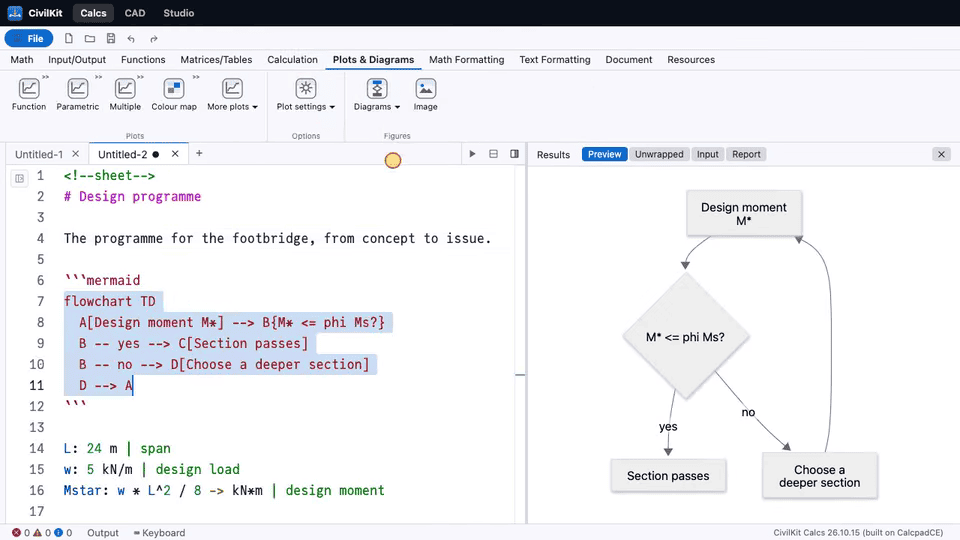
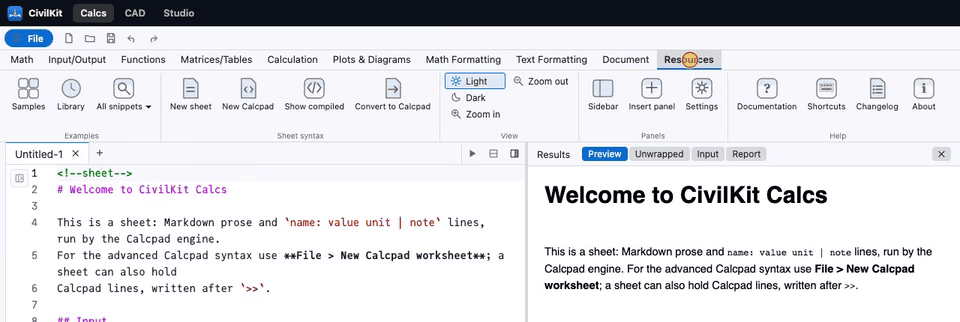
- Diagrams menu - The ribbon tab Plots is now Plots & Diagrams, with a Diagrams menu that inserts a short starter diagram of each common engineering kind, ready to edit, so no Mermaid syntax is needed to begin.
- Diagram samples - Twelve new sample sheets pair a diagram with the numbers behind it: state, sequence, Gantt, pie, treemap, quadrant, XY, Sankey, mind map, requirement, timeline and class diagrams.
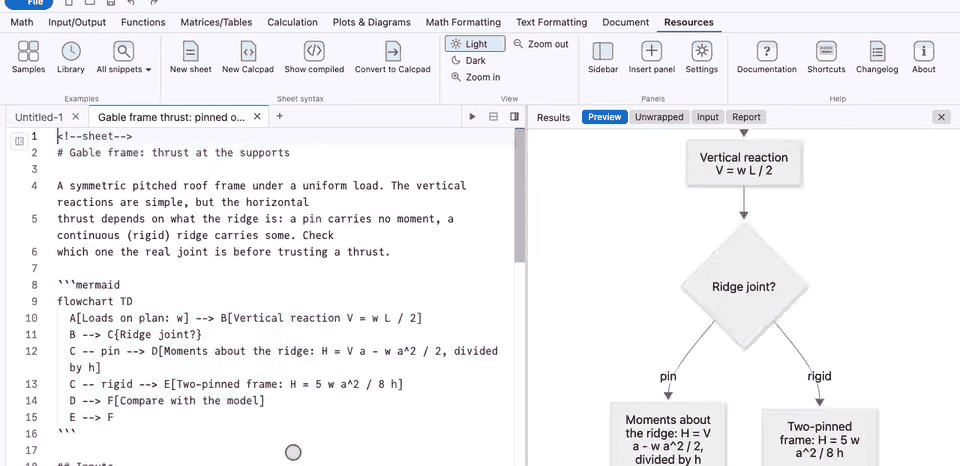
- Gable frame thrust sample - A worked sheet for the horizontal thrust of a pitched roof frame: pinned ridge, rigid ridge, and the shortcut that overstates it, with a decision diagram.
- llms.txt -
/calcs/llms.txtindexes the guide for language models and other tools, and/calcs/llms-full.txtis the whole guide in one file. Both are written bytools/make_llms_txt.mjs.
Changed
- Plots and diagrams - The Samples group Plots is now Plots and diagrams, and the two Mermaid samples moved there from Sheet syntax.
- Figures group - Image moves from the plot options into a Figures group next to Diagrams, and the Diagrams button has a flowchart icon.
- Ribbon order - The Calculation tab now comes straight after Matrices/Tables, so the tabs follow the work: write, calculate, plot, format, document.
- Ribbon fits - The tab strip fits a window down to about 900 px wide, and the Text Formatting and Resources tabs fit a 1300 px window, with small buttons where a tab was too wide.
- Ribbon groups - Document groups run Import, Tidy, Page, Report, then Save and export; Variables and Errors form a Check group on Calculation; Resources has View, Panels and Help groups.
- One data grid - Data grid is on Input/Output only, and the Input mode button there is now Input form, as on the Calculation tab.
- Ribbon icons - Buttons that shared an icon with a different button have their own, such as Hyperbolic, Determinant, Show results, Errors, Tidy text and Changelog.
- Ribbon tooltips - Every ribbon button says what it inserts or does, with the typed form where it teaches syntax, and shortcuts read Cmd on a Mac.
- Menu labels - Menus use sentence case and three dots for items that ask for more, the sidebar tab TOC is now Contents, and the editor menu says Calculate and Show Line in Results.
- Samples groups - Sample groups are in sentence case, Plots and diagrams comes before 3D plots, and the dialog's subtitle names the sheet samples as well as the classic examples.
- Phone targets - On a phone the quick-access buttons, the ribbon tabs and the small ribbon buttons are taller and easier to tap.
- Block menu marks - Paste has the same mark in the insert menu and the block menu, and Page break no longer shares the Copy mark.
Fixed
- Shortcut hints - Tooltips, the File menu and the Shortcuts list no longer name keys the browser keeps for itself, such as Ctrl+N, Ctrl+O and F5.
- Metadata in sheets - The editor menu no longer offers Edit Metadata Properties in a sheet, where it wrote a classic comment line.
26.10.14
Release notes
Added
- Landing pages - Ten static pages under
/calcs/learn/<slug>/(an alternatives overview, Calcpad online, a spreadsheet comparison, a hub, five task pages from the Templates samples, and a worksheet converter page), withsitemap.xmlandrobots.txt. They are generated bytools/make_learn_pages.mjs, every quoted number comes from a real engine run, andweb/e2e/learn-check.mjschecks them. The plan is indocs/seo-plan.md. - Sample deep link -
?sample=in the address opens a sample by id (with or without thetemplate-prefix), title or file name, for example/calcs/?sample=template-simply-supported-beam. The parameter is removed from the address once the sample is open.
Changed
- Precache - The service worker leaves out
learn/,sitemap.xmlandrobots.txtas well as the What's new page, so crawlers and first visits get the static pages and never the app shell.
Fixed
- Clicking a diagram - Clicking a Mermaid diagram or a code block in the preview now selects the whole block in the editor, instead of opening the one-line editor on its first line.
26.10.13
Block menu behind the grip
Fold sections and drag blocks
Text toolbar and name completion
A slider on an input
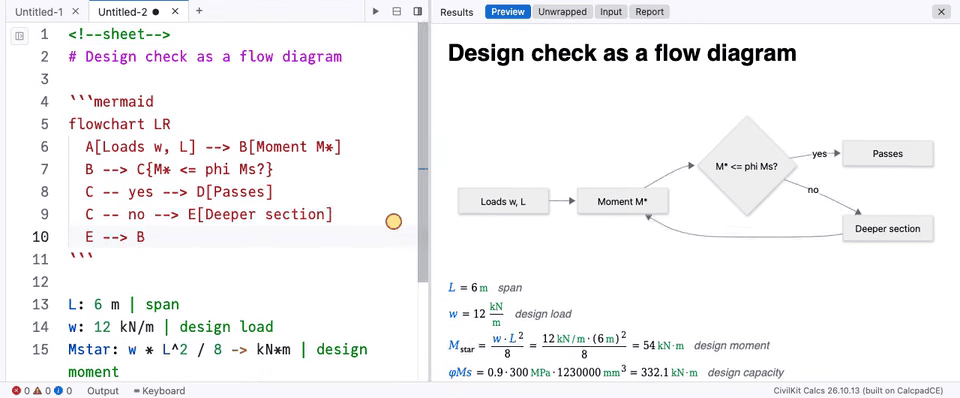
Diagrams drawn from text
Quick convert to a formula
Sort a table by a column
Release notes
Added
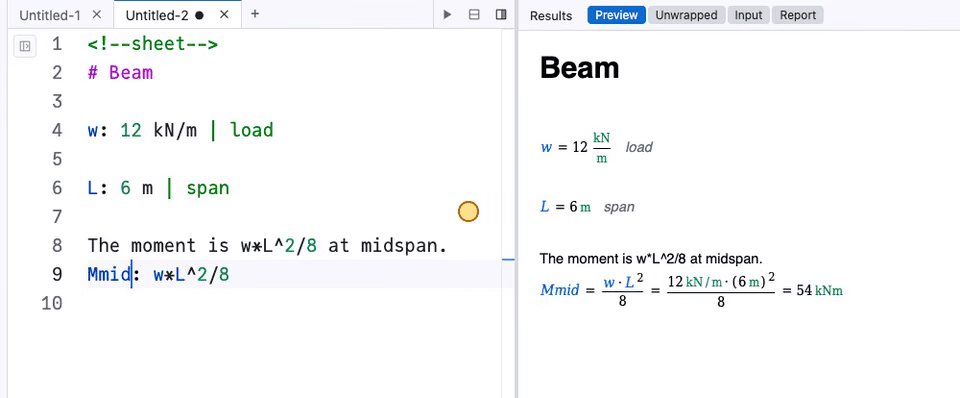
- Quick convert - Select an expression in text or in a calculation and press Ctrl+Shift+E (or use the editor menu, = Formula on the prose toolbar, or the button under the selection on touch screens) to turn it into a formula line: in text it becomes a line after the paragraph, in a calculation it is pulled out to a named line above. One undo step.
- Percentage output -
-> %and-> ‰show a ratio as a percentage or per mille in a sheet; see the percentages section of the guide. - Units of the sheet's own - A
#unit bag = 25 kg | noteline defines a unit for the rest of the sheet, usable after a number and after->. A bad name or value is an error on its line, and the editor colours#unitas a keyword. - Eigenvalues of any square matrix -
eigenvals,eigenvecsandeigenaccept a matrix that is not symmetric, without copying it intosymmetric(n). Complex results come from the newceigenvalsandceigenvecs, which return real and imaginary rows; the real functions refuse a matrix with complex eigenvalues and point to them. - Generalised eigenproblem -
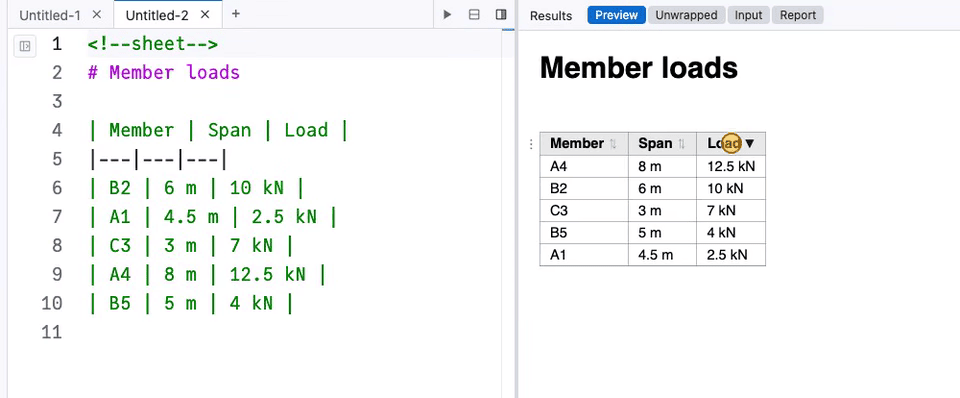
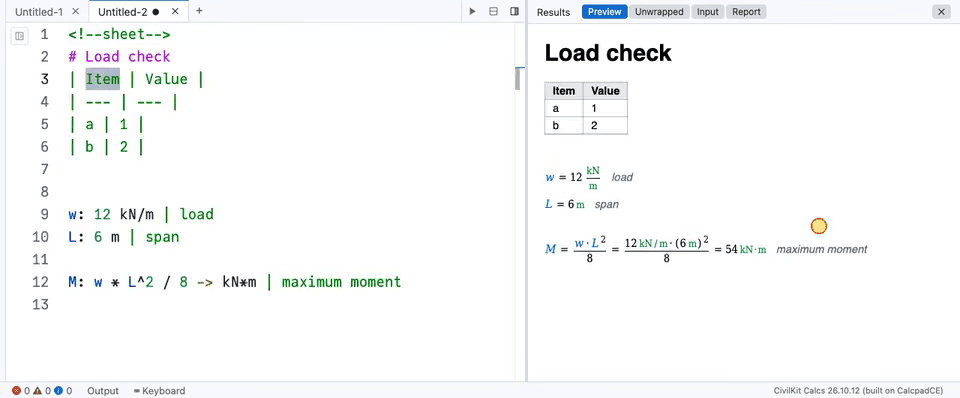
eigenvals(K; M),eigenvecs(K; M)andeigen(K; M)solve K x = λ M x for symmetric K and positive definite M. Eigenvalues come in ascending order, mode shapes are M-orthonormal, and a bad pair is refused with a message naming the problem. - Sortable tables - Click a column heading of a sheet table in the preview to sort ascending, descending, then back to the source order. It is a view only: the source is unchanged and printing keeps the source order. Headings are buttons, so the keyboard and touch work.
- Mermaid diagrams - A fenced
mermaidblock in a sheet, or in a#markdownblock of a worksheet, is drawn as a diagram in the preview, print and the HTML report; Word export shows the source. The diagram code loads only on a page that has one and works offline once visited. A fence that does not parse stays as code with the reason. In a fresh checkout,npm installis needed to get mermaid. - Page breaks - Page break is in the + menu between blocks and in the ribbon for sheets, drawn in the preview as a dashed line (screen only), and Word export turns it into a real page break.
- Unsaved changes - The window title starts with a dot while the active document is unsaved, closing an unsaved tab on the web offers Save, Don't Save or cancel, and the browser asks before the page is left with unsaved work. Exports do not count as saves.
- New samples - Two Mermaid diagram sheets (design flow, load path) and Principal axes of a section.
- Diagrams in the guide - A Diagrams chapter shows how to draw flowcharts and other Mermaid diagrams in a sheet, with three examples that the guide check runs.
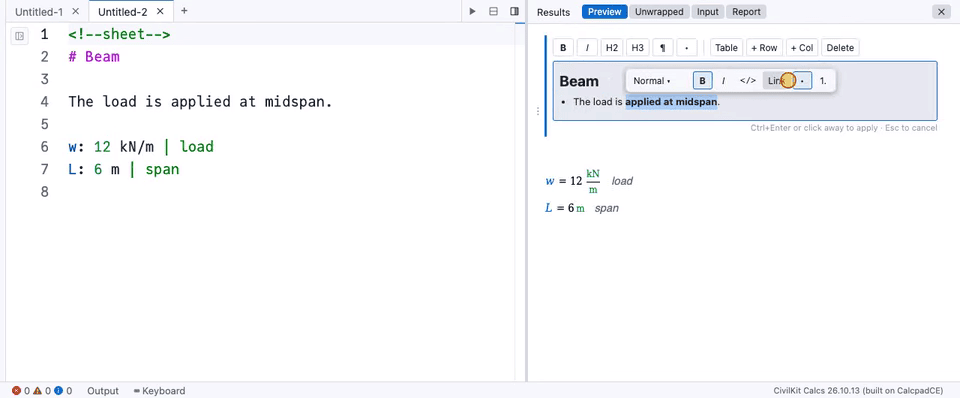
- Sliders -
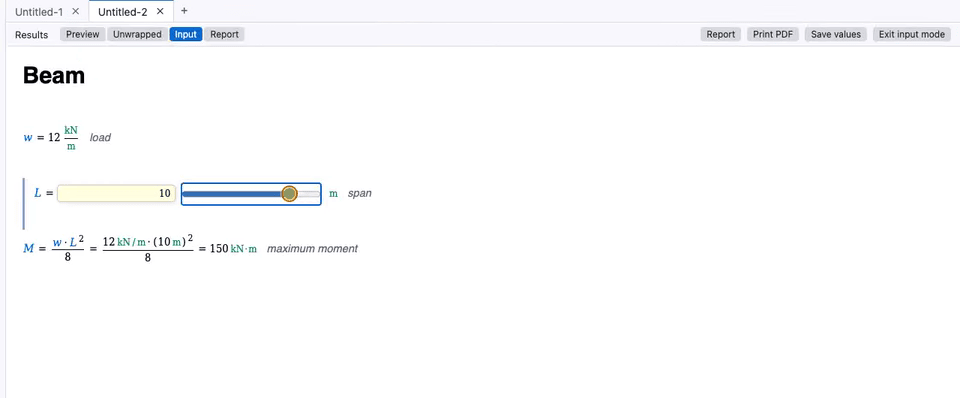
L: ? 6 m [2 .. 12 step 0.5] | spanis a number input with bounds, drawn in Input mode as a slider with the number box beside it. It works by touch and with the keyboard, a typed value outside the bounds showsmust be from 2 to 12beside the box, and the bounds are checked in the sheet; the engine's#UItakesmin,maxandstep(D17 in DEVIATIONS.md). - SI unit prefixes -
3 mN,5 µm,40 nF,1.2 kΩ,2 GPaand the like all work (yoctoyto yottaY; micro asμ,µoru), where before only prefixed names the unit list spelled out were units. Non-SI units stay unprefixed;ksis still the metric horsepower. See D16 in DEVIATIONS.md. - Folding sections and key results - A heading that ends with
{collapse}folds the section under it in the preview and the report until the reader clicks it, a line ending with{key}gets a star, and{key results}lists the key lines above it. Print, PDF and the exports show everything; the preview's own fold arrow on other headings is a separate view-only fold. - Editor navigation - One completion provider serves worksheets and sheets (names above the cursor with their last value, the function being written, built-in functions, units, block keywords), nothing is offered in prose, notes or strings, and Rename Everywhere (F2) and a Variable palette (Ctrl+; or Cmd+;) work in both editors.
- What's new page -
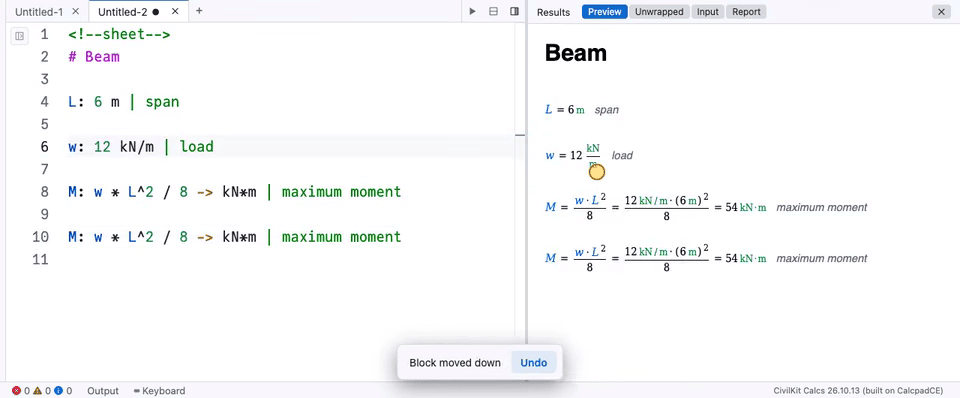
whats-new/beside the app shows, for each release, a few short looping clips of its headline features and then the changelog's Added, Changed and Fixed items.tools/make_whats_new.mjswrites it fromCHANGELOG.md, andweb/e2e/whats-new-check.mjschecks it. - Block grip menu - A grip beside each block of the sheet preview opens a menu to move, duplicate, cut, copy, paste below, disable or enable and delete the block, with an Undo toast; Ctrl/Cmd+Shift+K deletes the block at the caret.
- Heading collapse and drag reorder - Headings in the sheet preview fold their section with an arrow (Collapse all and Expand all in the heading's menu), and dragging a grip moves a block, or a heading with its section.
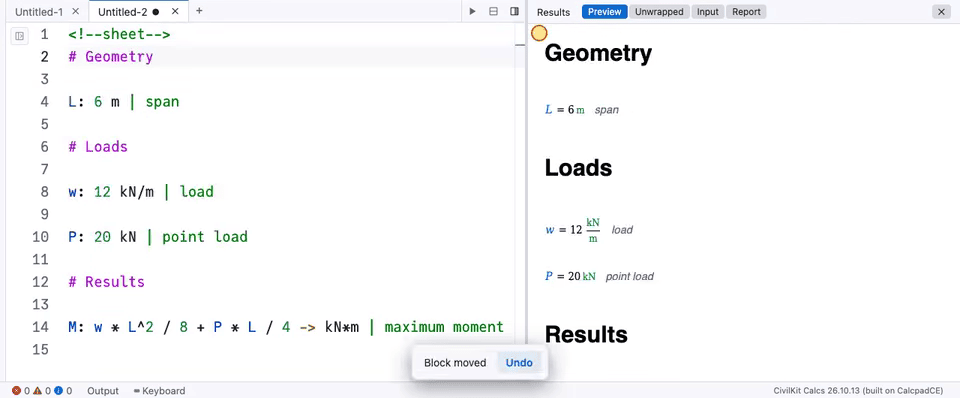
- Prose toolbar - A floating bar over prose in the source and in-place editors (Style, bold, italic, code, link, lists) whose tooltips show the Markdown each button types.
- Name completion in calculation lines - Typing in a sheet calculation offers the names defined above and the built-in functions, and nothing while writing prose.
Changed
- Input form focus - The input form keeps the focus on the control you were using when it re-runs the sheet (a slider, a drop-down, a radio button or a box), so the arrow keys keep moving a slider.
- Find references - In a sheet it uses the same scan as rename, so a parameter is a separate name and strings and units are not matches.
- Borderless block grip - The grip beside a block is plain dots with no border, with a soft highlight on hover.
- Importer function list -
ceigenvalsandceigenvecsare listed as engine function names when a worksheet is imported.
Fixed
- Deleting or moving a block - Hidden code (
>> #hidelines and loop code) is now its own block, so deleting or moving the block above no longer takes it along. - Insert menu - It fits the window and scrolls when the list is longer than the screen.
- Folding headings - The preview's own fold arrow leaves headings that end with
{collapse}to their own marker. - What's new page - Bold text that contains a code span renders as bold.
26.10.12
Templates with inputs
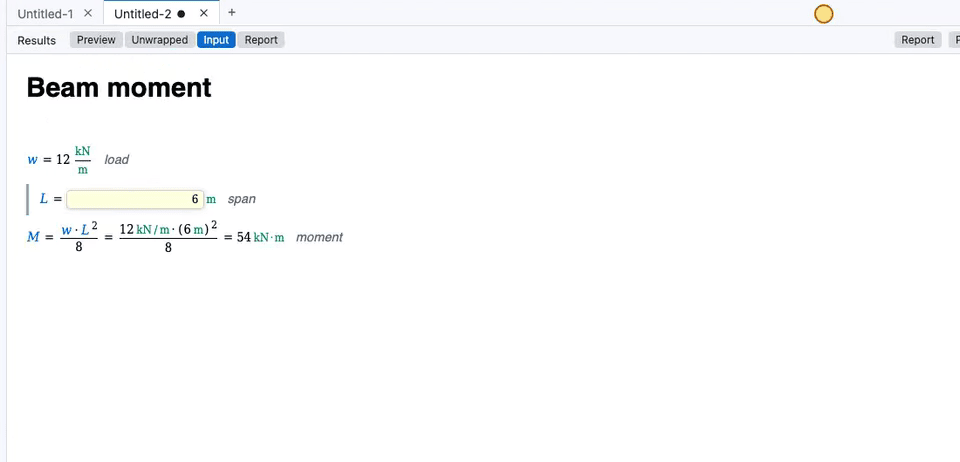
An input is one line of a sheet
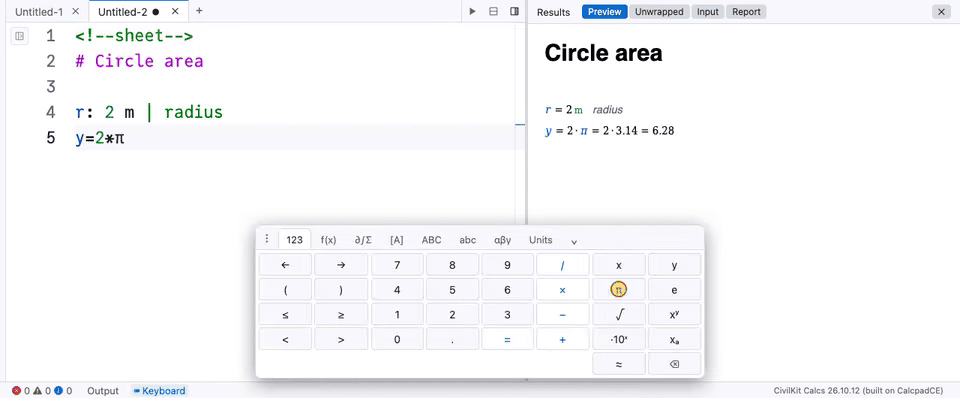
On-screen math keyboard
Insert strip between blocks
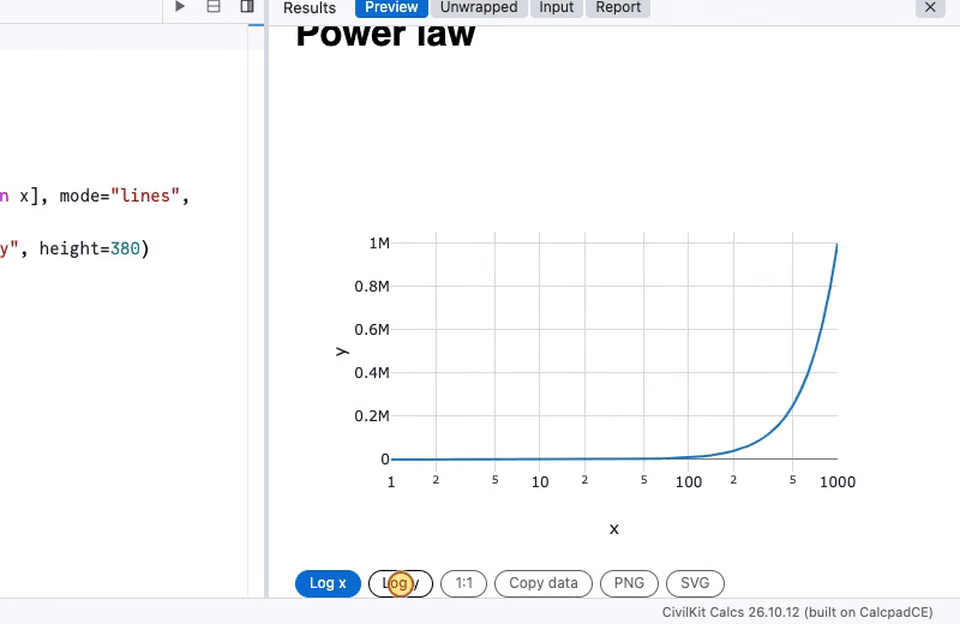
Plot chips: log axes and save as PNG
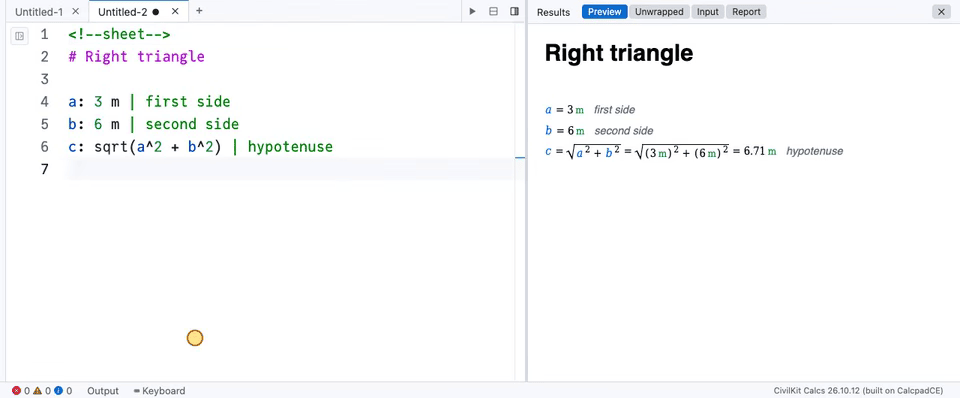
Edit in place
Release notes
Added
- User guide - Getting started, the sheet format, units, plots, Python, templates, importing and exporting, at
/calcs/guide/. Every example in it is run bybook/check-examples.sh, and eight short how-to videos go with it. - On-screen math keyboard - Tabbed keys and templates for touch screens, and a draggable floating panel on desktop (Keyboard in the status bar).
- Insert strip - A dashed line with a + appears between rendered blocks; click it to insert a math line, text, heading, list, table, plot, condition or Python block there.
- Plot chips - Log x, Log y, 1:1, Copy data, PNG and SVG under each plot in the preview.
- Edit in place - Click a block in the preview to edit it where it stands; click away to apply, Esc to cancel.
- Sheet inputs - A line such as
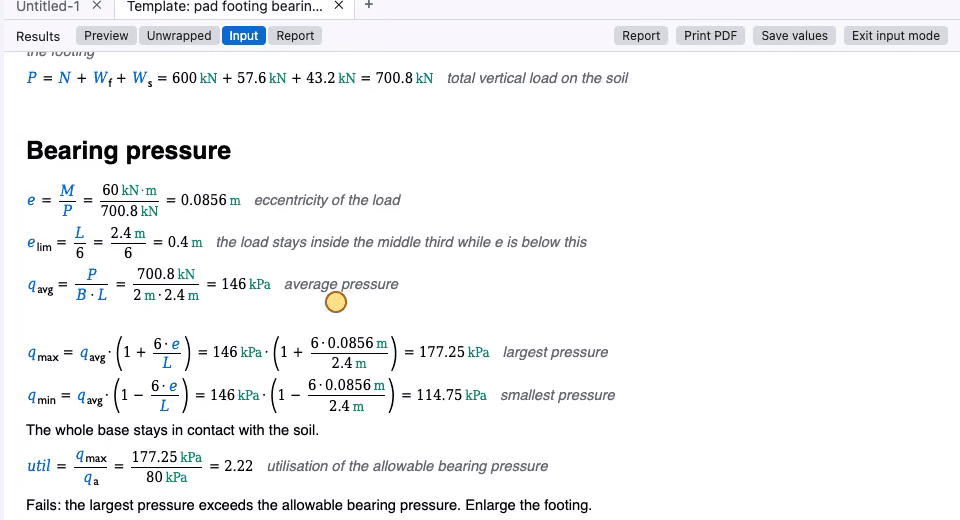
L: ? 6 m | spanbecomes a number box,E: ? [Steel = 200 GPa, *Timber = 11 GPa]a drop-down (round brackets for radio buttons) andribs: ? ona checkbox. They compile to the engine's#UIcontrols, so reports and Word and Excel exports work unchanged; see "Inputs and templates" in docs/sheet-syntax.md. - Templates samples - Seven sheets that use inputs: beam check, cantilever, column slenderness, pad footing, pipe flow, retaining wall, pump and pipeline. Generic textbook formulas, no design standard.
- Input buttons - The ribbon's Entry, Dropdown, Radio and Checkbox buttons insert the sheet form.
- Tennis ball flight sample - Drag, Magnus lift, spin and serve trajectories; large matrices also get a taller box.
- Suite bar - On screens 900 px wide or more in the browser, a slim bar above the ribbon links to the other CivilKit apps.
- Theme in the address -
?theme=darkor?theme=lightsets the theme for that page load without changing the saved choice. - Input check -
e2e/inputs-check.mjschanges each kind of input in a template and checks the result, the saved values and the exports.
Changed
- Three sidebar tabs - Insert, TOC and Variables; Settings, Export, Errors and Prettify open as dialogs, and Prettify joins the Document ribbon.
- Browser shortcuts - In a browser the app leaves the browser's own keys alone (address bar, tabs, zoom, bookmarks, print, new window).
- Shared suite theme - Ribbon, panels, dialogs, editor, results and charts use the shared palette in light and dark, with a quieter status bar. Printed reports and exports keep their light styling.
Fixed
- Units - The dot operators and the micro sign
µare read correctly (5 µmfailed before). - Radio and drop-down defaults - A default with a divided or multiplied unit (
25 kN/m,N/mm^2) now selects its option instead of opening empty. - Names from
>> #UI- A name defined by a raw>> #UIline can be used by later sheet lines (it failed withUndefined φ). - Save values - The comment is now written under the
<!--sheet-->marker, so the file stays a sheet. - Browser check -
e2e/browser-check.mjsfollows the three-tab sidebar and the new dialogs.
26.10.11
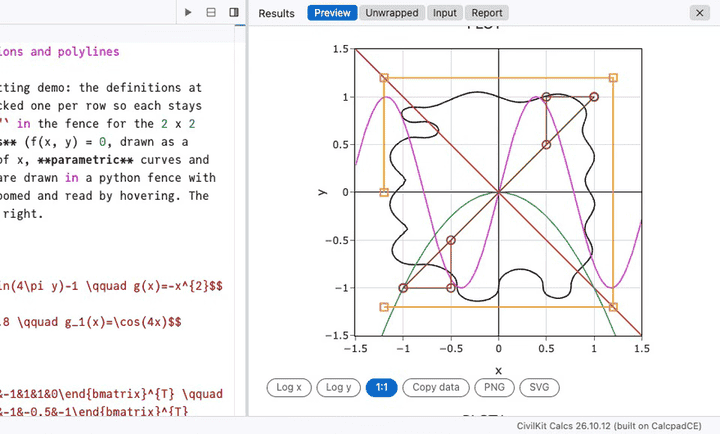
Plots sample
Release notes
Added
- Longer time limit prompt - When a Python block hits its 10 s limit, the page offers to rerun with a longer one (60 s per block, 180 s per calculation), remembered for the tab; endless blocks are still stopped.
- Plots sample - A plot gallery of four plots on a grid, covering implicit curves, functions, parametric curves, noise, markers, a legend and a second y axis.
- 3D plot samples - Five samples (plate deflection, column interaction surface, space frame, mode shape explorer with a dropdown, footing reactions bar chart), each checked in light and dark themes.
- Importer text values - Programs and functions that set, return or take a text (
check <- "OK") and tables mixing text names with numbers now convert live; across a local set of 16 structural worksheets the live share rose from 82.7 % to 87.4 %. - Clearer
string-valuegaps - The gap now names what stopped it, such as a text-and-number mix or the text function called, which were previously reported asbuiltin-missing. - Importer external libraries - A definition blocked only by an external library call takes the value the source saved, shown frozen and labelled; the import dialog counts these and the batch example lists why functions did not convert.
Changed
- 3D plot theme - The walls of 3D axes now follow the light or dark theme.
Fixed
- Importer text-or-number results - A function returning text for some arguments and a number for others now prints the number, and a text-or-number table copied with
B := Ano longer prints text codes.
26.10.10
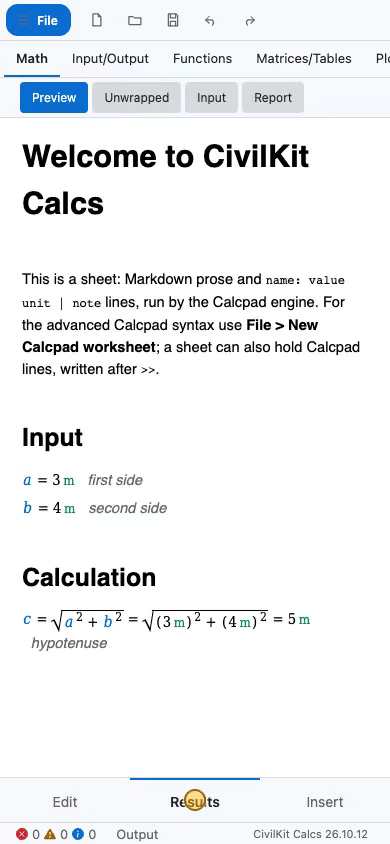
Phone layout
Release notes
Added
- Phone layout - At 760 px wide or less the app shows one pane at a time (Edit, Results, Insert) from a bottom bar, with a folded ribbon, finger-sized controls and keyboard and safe-area handling; desktop and tablet are unchanged.
- Touch editing - A half-second long press on a rendered line, paragraph or table opens the in-place editor, and the keyboard hint is hidden on touch screens.
- Editor above the keyboard - The in-place editor follows the window when an on-screen keyboard opens and keeps its buttons above the bottom bar.
- Touch key row - A scrolling row under the line editor inserts symbols (
^ * / ( ) = < > ≤ ≥ √ π °) and common units at the cursor without closing the keyboard. - Phone results toolbar - The toolbar drops its label, scrolls sideways instead of wrapping, and the plot hover toolbar is left out; pinch and drag still work.
polyroots(v)- Returns the real roots of a polynomial in ascending order from a coefficient vector with the constant term first.- Sample: Laguerre polynomial roots - Coefficients from a loop, all real roots from one
polyrootscall, a residual check and the curve. - Sample: Beam deflection derived symbolically - Derives the midspan deflection of a simply supported beam with the Symbolic dialog, then checks it numerically against the curve.
Changed
- LaTeX variable colours - Variables in sheet LaTeX are coloured like the engine's equations (blue in light theme, light blue in dark).
26.10.9
Symbolic dialog
Release notes
Added
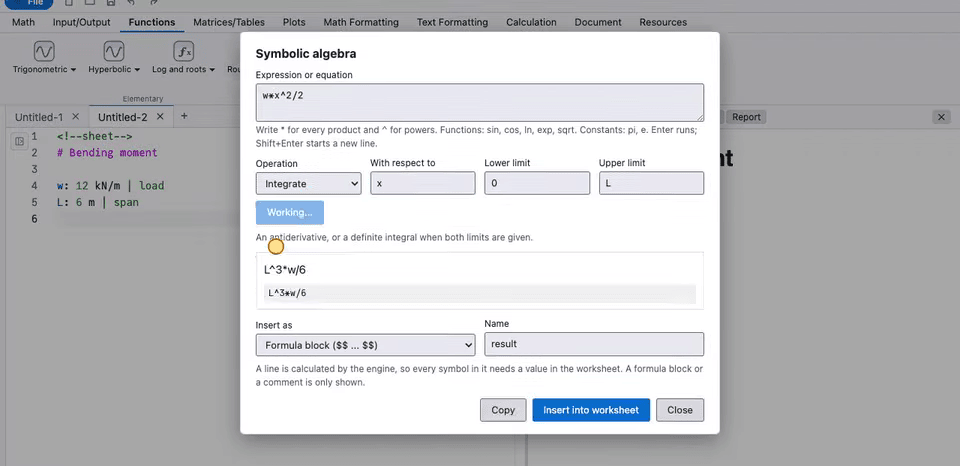
- Symbolic dialog - On the Functions tab: simplify, expand, factor, differentiate, integrate, solve, substitute and evaluate, with typeset results you can copy or insert into a worksheet or sheet. It loads only when first used (
docs/caskit.md). - Computer algebra library - A new pure-Rust library for engineering formulas with exact rationals, simplify, expand, factor, diff, integrate and linear and quadratic solving; anything unsupported is an explicit error.
26.10.8
Rich-text editing in place
Release notes
Added
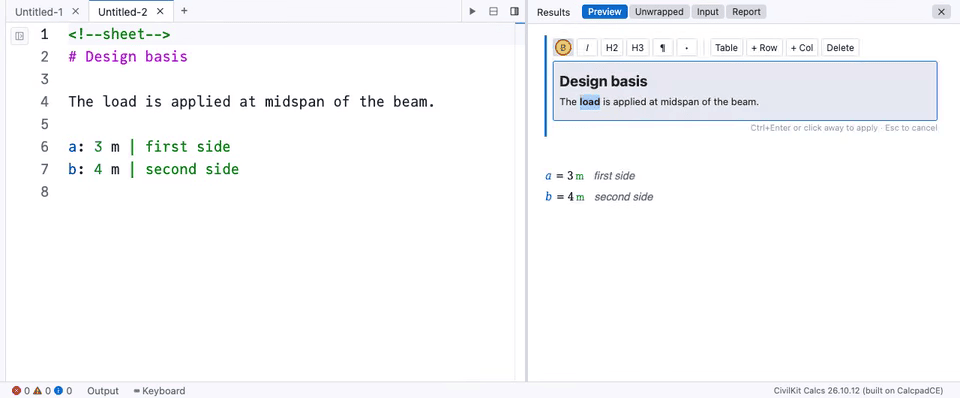
- Rich-text Markdown editing - Double-click Markdown prose (a
#markdown...#end markdownblock) to edit with bold, italic, headings, bullets and tables; Apply writes raw Markdown in one undo step, and unchanged paragraphs keep their exact source (docs/rich-text-editing.md). - Rich-text editing in sheets - Double-clicking prose in a sheet opens the surrounding heading, paragraphs, list or table as one block; input lines, calculations and fences stay one-line edits.
- Import options: Tidy and Markdown - Tidy text and Text to Markdown (import dialog and ribbon) strip imported fonts, sizes and colours and turn prose into clean Markdown, leaving equations, pictures and visible text untouched (
docs/worksheet-import.md). - Markdown tables - Pipe tables are drawn with thin rules, padding and a shaded header in preview, print and DOCX export (deviation D14); layout tables, bordered tables and matrices are left alone.
- New build notice - A small box offers Reload or Later when a newer build is ready, never reloads by itself, and checks every 30 minutes and when the tab is shown again.
- Importer early exits -
return,breakandcontinueinside function bodies convert, and locals that may be unset on some path give undefined rather than zero. - Importer ranges and arrays - Stepped ranges (
x := 0, 5 .. 100) work as tables, plot domains and loops; arrays grown by element, element assignments on existing arrays, whole-column writes, and arrays of vectors (V[k][j]) all convert, and[A, B] := programdefines each name. - Importer complex numbers - Complex values are handled as real and imaginary pairs (
z__re,z__im) with products, quotients, powers 2 to 4,Re,Im,absandconj; a complex value where a real is needed is a clear gap. - Importer
try ... on error- Now looks through single-expression functions and common math functions, and functions whose value is anifor loop convert without a block. - Importer solve blocks -
.mcdxsolve blocks with one or two unknowns convert to an iterating solver that keeps the result only if every equation agrees, and solve-block regions are reported individually; solvers with a saved value take it frozen and labelled. - Importer lazy
if- One-line definitions whose branches call functions or index arrays are evaluated in an expression block so the untaken branch cannot fail. - Importer
CeilandFloorwith a multiple -Ceil(L, in)rounds up to a multiple of the second argument, noted asround-digits. - Importer worksheet references - A referenced worksheet found in the package is followed: its definitions are computed in a hidden block, closing many undefined-name gaps.
- Importer text-or-number values - Values that are a number on some paths and text on others compute where numeric, undefined where text, and print either; vectors of texts become vectors of codes, while vectors mixing texts and numbers stay gaps.
- Importer controls and button values - Combo, text and list boxes convert to their stored selection, scripted buttons and check boxes to their stored value (note
control-input), and bare names or products with no result show as written (inert-expression). - Importer file output - Calls that write files (
WRITEEXCEL,WRITEPRN,APPENDPRN,WRITEBMP) show as written (file-output),csortandrsortmap tosort_rowsandsort_cols, and aREADPRNwith nothing saved stays a gap. - Importer plot lengths - A plot of arrays of different lengths stops at the shorter array instead of reading past its end.
- Importer readable names - Names the engine cannot spell (dots,
#,/,:, spaces, leading digit) get one readable spelling sheet-wide (SF_crack.step2becomesSF_crack_step2) while typeset equations keep the author's name, closing mostinvalid-namegaps. - Importer text checks - Text values in checks (
if(c; "OK"; "NG"), comparisons, names and functions holding text) compute, and evaluations show the text; text used as a number, joined or sliced is still astring-valuegap. - Importer last-
ifprograms - Programs whose value is their lastifconvert, along withalsoif,return x <- e, chained comparisons (a < b <= c) and programs ending in an assignment, and paths where nothing ran are undefined with noteuncovered-path. - Importer data-file tables - Tables read from files the importer cannot see (
READEXCEL,READPRN) take the saved value, frozen and labelled; unset paths stay undefined. - Importer collapsed regions - Regions inside collapsed areas are calculated in file order, and names defined in hidden regions are defined before use.
- Importer small additions -
linterp(xs, ys, x)maps tointerp(x; xs; ys), andx%,nthRootwith a degree, the unitsplf,pcf,klf,kcf,pliandkips, and sub and superscript text are supported. engine_checkexample - Takes region markers from the importer, prints engine error messages and draws plots as vector graphics; new helpersrun_cpdanddump_region.- Engine statistics -
median,stdev,stdevp,var,varp,cumsum,convolve,linspace,polyfit(x; y; n)andinterp(x; xs; ys)(error outside the table) are in autocomplete, help and the ribbon. - Importer x-y plots - Plot regions convert to
$Plot{...}with multiple traces, axis units, range variables, titles and labels; unsupported styles are dropped with aplot-stylenote and other plot kinds stay named gaps. - Importer function bodies - Functions with run-time loop bounds,
whileloops and element writes to an argument copy convert to expression blocks, and ones that fill an array by element without making it create it first as zeros. - Engine nested loops (D12) - A loop inside an expression block now updates the enclosing block's variables, so function bodies can accumulate.
linterp(x; xs; ys)- Linear interpolation that extends along the first or last segment outside the table (interperrors there).- Importer program results - Programs return their last statement's value, including sequential
ifs and trailing assignments; a path with no value is undefined, never zero. - Importer function mappings -
matcol/matrowbecomecol/row,nthRoot(n, x)becomesroot(x; n),%is the percent unit, elements of non-names usetake(i; array), and sums withlowerBound/upperBoundconvert. - Importer division-safe
try-try expr on error fallbackconverts when only a divide by zero can fail, by testing every divisor; anything else is a gap that says so. - Importer gap reporting - Element writes that depend on an earlier gap are reported against it, so
ranked_gaps()points at the real cause.
Changed
- Importer program arrays - An array a program writes by element is the program's own even if the worksheet has a same-named array.
- Importer text-label rows - A row of text labels written by element is held as codes, so printing the table gives the
string-valuegap instead of silently losing the header row. - Single unit after vectors - A vector or matrix with one shared unit shows it once after the bracket (
s = [16; 12; 3] ft);#settings {"unitPerElement": true}restores the old display. - Importer angles - Angles are plain numbers (
degand°are pi/180,radis 1), fixing unit errors and a factor-of-57.2958 display error. - Importer zero comparisons - A bare
0compared with a quantity takes its unit everywhere, and also inifbranches,max,minand sums. - Importer unit overrides - A number-only override such as
10^(-3)divides the value, and a display-unit evaluation is((expr)/unit)*unitso mixed units like kip times length are accepted. - Importer list and text boxes - A list box is its selected position from 0, and an empty text box read by
str2numis 0. - Importer array values - An array value is no longer put into one element of a vector; the region is an
element-assignmentgap with the reason. - Importer equation indent - An equation's page indent shrinks before the equation does, so far-right matrices keep their width in narrow previews.
- Nested
ifspacing - Nestedifresults have more line height and room between braces. - Importer vector products - The product of two column vectors is
dot(a; b), and arrays assigned from another array name are copied. - Importer function names - A worksheet function named like an engine function (
Norm,Max,Sin) gets an_fsuffix.
26.10.7
Python is coloured
Release notes
Added
- Typeset equations on import - Imported equations are shown as proper maths with stacked fractions, bounded sums and integrals, subscripts and matrices, in light and dark themes. Set the importer option
mathmlto turn it off; Word export gets Office Math and Excel export gets readable text. - Import fidelity - Imported sheets follow the original look: names, units (
100 ft), vector arrows, indents, range tables, Greek text and stacked unit fractions all match the source. - Original equations for definitions - A definition shows only the author's equation, and an evaluation shows the expression and its result, using the original names and the decimal places stored in the file.
- Result display setting -
#settings {"valMathml": true}makes#valwrite a result as MathML with the unit once; it is off by default and used by the importer. - Unconverted regions - A region that cannot convert is shown as the original typeset equation with a short reason, and it is never evaluated.
- Frozen input values - Numbers read from a saved input (spreadsheet) component now define their names, so regions that depend on them convert, and the dialog shows a count.
- More maths converts -
kN·munits, integrals ($Integral), first derivatives ($Slope), sums and products over bounds or a range variable, and range-variable tables now convert. - Programs convert - Local definitions,
for,while,if/else,break/continueand final values become#for/#while/#ifstatements, or one expression when straight-line. A program that cannot convert faithfully stays a gap that says why. - More functions and arrays -
lsolve,submatrix,augment/stack,vectorSum,lastandvectorizemap to engine functions, and element-by-element arrays are allocated first. - Import
.mcdxfiles - File > Open, the Import button and drag and drop now accept.mcdx, with unsupported parts listed as skipped with a reason. Details in docs/worksheet-import.md. - Installable and offline - The app can be added to a home screen or installed, and it opens and calculates without a network. Interactive charts need their script loaded once while online.
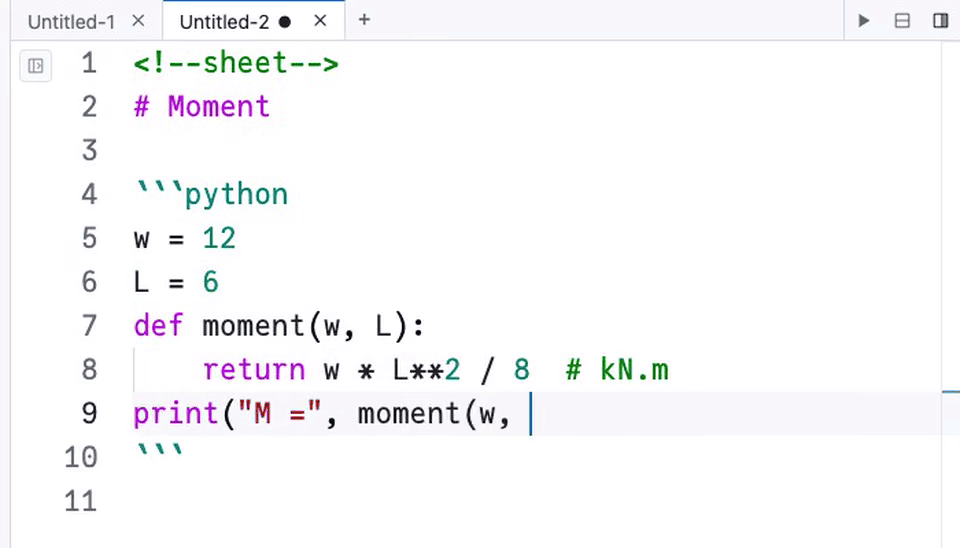
- Python highlighting -
#pythonblocks and sheet python fences are coloured with the Python grammar. - Side-by-side regions - Regions that share a row in the source are laid out side by side while keeping their evaluation order.
- Cleaner loops and arrays - Loop blocks no longer print raw values in the preview, and an array accumulated from 0 takes the units of the first value added.
- Source text styling - Paragraph styles, fonts, sizes, colours and alignment carry over, and picture regions now convert and keep their size.
- Better conversion rate - Two handbook worksheets went from 70% and 65% to 95% of regions converted, with values matching the saved printouts.
Changed
- Importer renamed - The importer crate and its WebAssembly module now have format-neutral names (
calcpad-import,calcpad-import-wasm), since they read both.xmcdand.mcdx.
26.10.6
Plotly charts from Python
Release notes
Added
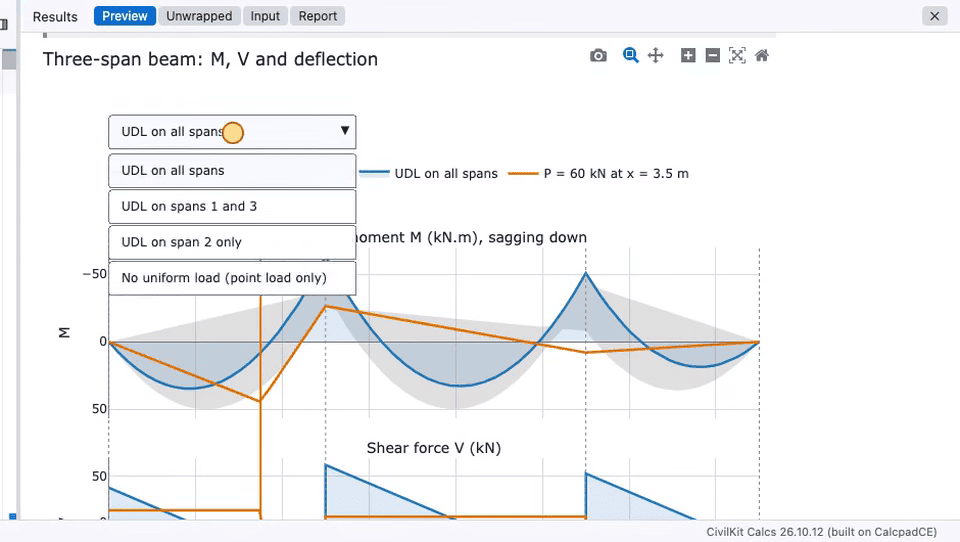
- Charts from Python - Python blocks can build interactive charts without HTML or JavaScript:
import plotly.graph_objects as go,go.Figure, common traces, layout updates,fig.show()andmake_subplots. Keywords pass straight through, anything unsupported fails by name, and the chart script loads only when a figure is present. See docs/python-blocks.md. - Beam Explorer sample - "Beam Explorer: Plotly from Python" solves a three-span beam in Python and explores it with a load case menu, a load factor slider (0.50 to 2.00) and a point load position slider, and an end-to-end check validates its moments.
Changed
- Raw JS beam explorer kept - The HTML and JavaScript version is now "Beam Explorer: Python Results in Raw JS Plotly", the script-route example, and the new sample comes first in the Python group.
26.10.5
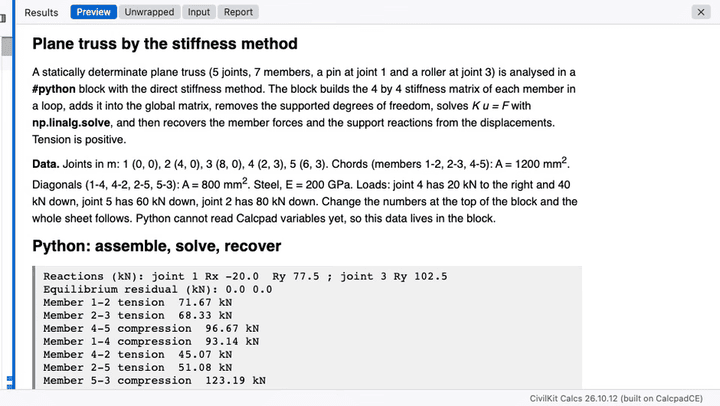
Plane truss in Python
Release notes
Added
#pythonpair in sheets - A sheet accepts#python...#end pythonas a Python block, the same as apythonfence.- Linear algebra in Python -
numpy.linalgandscipy.linalgcalls such assolve,inv,det,cholesky,eighandsvdrun on the engine, so Python and worksheet lines give one answer. Large matrix products are about 7 times faster, and a 120 by 120 solve takes 87 ms instead of 1.5 s. See docs/python-blocks.md. - Build script -
tools/build_wasm.sh linalgbuilds the new module. - Plane Truss sample - "Plane Truss by the Stiffness Method" assembles and solves a truss in Python, draws forces and deflections, and checks results against hand values.
Changed
- Section sample moved - "Built-up Section Properties" now lives in a new Sections group and uses vectors and
hprodwith no Python, so units carry through and the report shows every substitution. - Linear algebra note - docs/python-blocks.md records why a smaller numpy-like module was measured and not shipped.
Fixed
- Exported names in sheets - Names handed over with
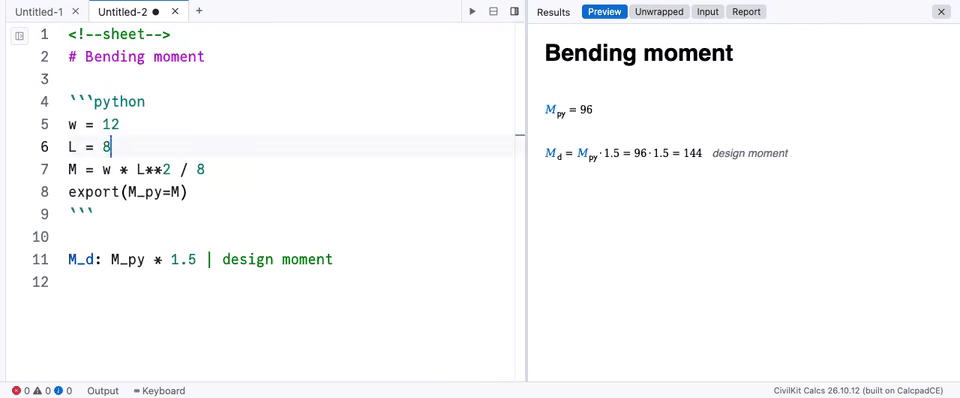
export()now use the sheet's spelling, soexport(sigma_c=2)is found below the block asσ_c.
26.10.4
Python values used by later lines
Release notes
Added
- Python blocks -
#python...#end pythonblocks in a worksheet, or a ``python fence in a sheet, run before the engine. Output appears as text, figures as SVG, andexport(name=value)` hands numbers back as definitions. Runs are sandboxed with no network or file access, a 10 s limit and capped output; see docs/python-blocks.md. - Editor support for Python - Python blocks get no worksheet errors, exported names are defined for the lines after, formatting leaves them alone, and the ribbon inserts a
pythonfence. - Python samples - Four samples: a beam explorer with an interactive chart, a beam moment diagram, a function plot and section properties. Math > Programming gains
#pythonentries.
Changed
- Samples browser - It shows the source of a Python sample instead of running it.
- Faster heavy worksheets - The heaviest worksheets calculate faster with identical output; Soil Stress and Deformations took 72 s of CPU time before and 33 s now.
26.10.3
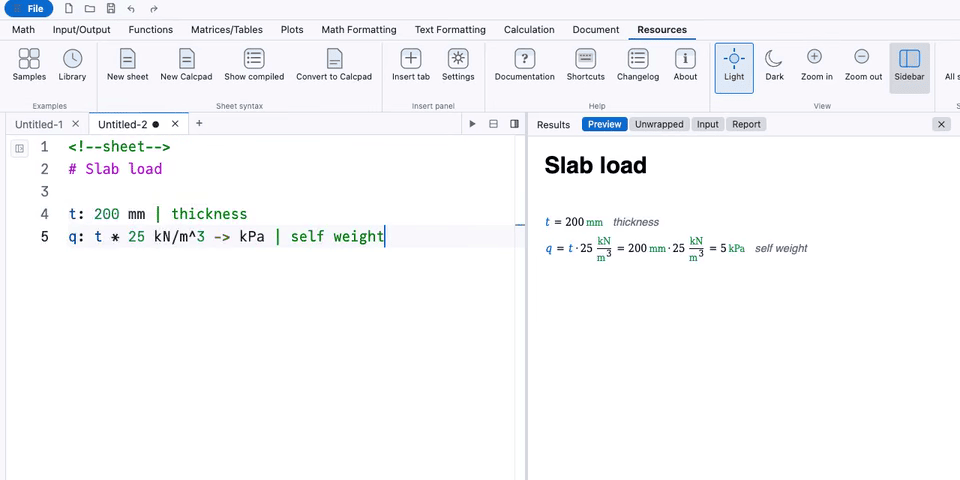
Sheets: name, expression, unit, note
Release notes
Added
- Sheet syntax - The new default way to start a worksheet: Markdown prose with
name: expression -> unit | notelines, LaTeX in prose, vectors, matrices, plots, andfor,while,repeatandifblocks. A sheet starts with<!--sheet-->or is a.sheetfile; see docs/sheet-syntax.md. - Sheet editor support - Colours, name completions, Format Document, go to definition, find references, hover and semantic highlighting, with errors and lint markers reported on the sheet line.
- Show compiled / Convert - The Resources tab can show the classic-syntax version of a sheet or convert it.
- Sheet-aware insert tools - The ribbon, Text Formatting tab and sidebar Insert tab insert the sheet form of each item; items with no sheet form insert raw classic syntax as
>>lines and are marked. - New sheet by default - File > New and the New button open a sheet (Ctrl+N too in the desktop app), and a separate New worksheet entry opens the classic syntax.
- Sheet samples - Eight sheet samples sit at the top of the Samples dialog, including beam deflection and cantilever examples.
- Changelog links - A Changelog button on the Resources tab and a What's new link in About.
Changed
- Cleaner compiled output - The compiled version of a sheet reads as if written by hand, with headings as heading lines, one text line per plain paragraph, and blank lines between sections kept.
26.10.2
Release notes
Added
- Import worksheet - File menu, a Document-tab ribbon button and drag and drop bring in
.xmcdworksheets, converted in the page into a new unsaved worksheet with pictures kept in the library under/imported/<name>/. It reports what converted, what became a static picture and what needs attention;.mcdxfiles are refused with a message. - Drop hint - While files are dragged over the page, a full-window hint says whether a drop opens a worksheet (
.cpd) or imports one (.xmcd). - Faster library writes - Many files can be written with one store write and one sync, which matters when an import adds hundreds of pictures.
- Licences - THIRD_PARTY_LICENSES.md now lists the extra Rust crates the importer uses.
Fixed
- Relative includes - Relative
#includepaths now resolve for worksheets that have a source path, such as the Frames samples.
26.10.1
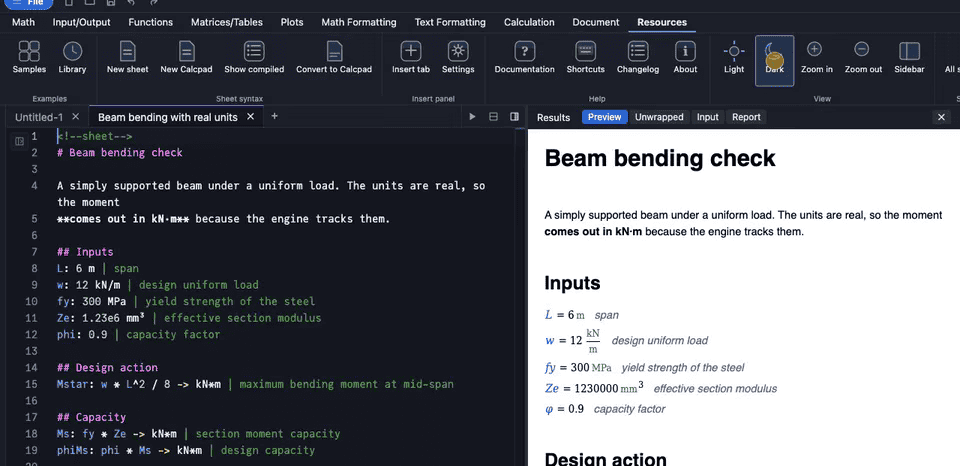
Samples browser and dark theme
Word export
Release notes
Added
- Rust calculation engine - Compiled to WebAssembly, so no calculation request leaves the page.
- Editor services module - A second WebAssembly module, loaded on first use, provides highlighting, linting, prettifier, definitions and the snippet library.
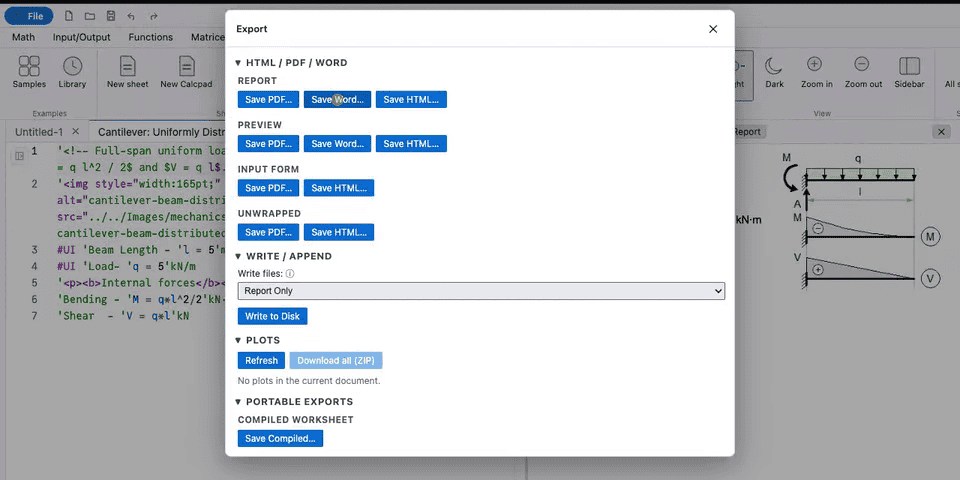
- Word and Excel export - Word export writes equations as Office Math; Excel export has a Report sheet plus Variables, Inputs and Plot data sheets, with native charts. Both are built in the page.
#UIinput forms - Select, radio and checkbox values carry into the report, and the preview has a dark theme.- Samples browser - 101 example worksheets with their input fields rewritten as
#UI. - Ribbon interface - Ten tabs, palette popovers with a Common section above the full snippet library, and light and dark icons.
- Model bindings -
civilkit: bindcomments have a specification, parser and in-app display; connecting a model is not implemented yet. - Restricted scripts - Worksheet scripts are limited to a library list under a Content Security Policy.
- Version display - The version (YY.M.N) shows in About, the status bar and
<meta name="version">, andtools/set_version.mjskeeps every manifest in step.
Changed
- Product name - The product has its own name, and the original project is credited in About, README, LICENSE and NOTICE.
Known limits
- Unsupported features - Raster plots,
#ProjectPathand#LibraryPathpath roots, and compiled.cpdzworksheets are not supported. - Office testing - Exports are untested in the Office apps; Excel files were only checked in other spreadsheet tools.
- Deviations from CalcpadCE are listed in DEVIATIONS.md.
The same notes are in the changelog and on the releases page.